

The Fibonacci 50% Retracement Strategy
The **fibonacci 50 percent retracement strategy** is one of the cleanest ways to buy a pullback inside a trend without guessing where the bottom is. The idea is simple: a market makes a strong, one-directional move (an impulse leg), then pulls back to roughly the halfway point of that move — and if the pullback *holds and confirms*, the market tends to continue in the original direction. Instead of chasing the breakout or trying to catch a falling knife, you wait for price to come back to you, prove itself, and only then commit.
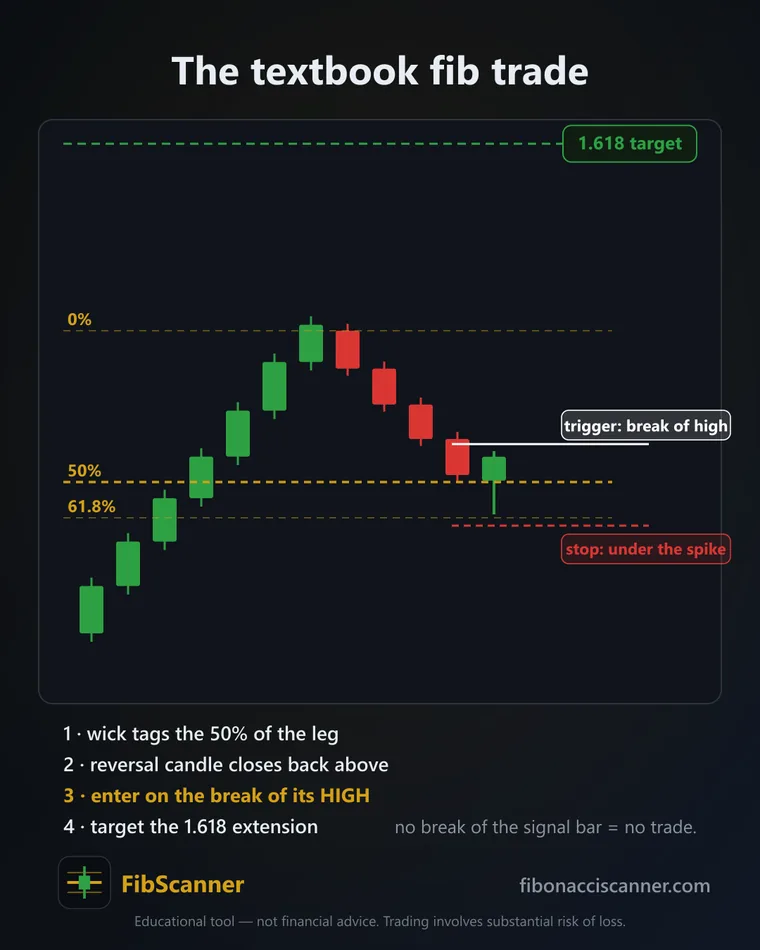
This is the exact skeleton the FibScanner engine is built on, so this article walks through the real rules rather than the vague "draw some lines and hope" version you usually see. By the end you'll know what has to happen before you enter, where the stop and target actually go, and how the setup flips between long and short.
Why does the 50% level anchor the fibonacci 50 percent retracement strategy?
The 50% level matters because it is the point of maximum indecision in a trend — deep enough that weak hands have been shaken out, but shallow enough that the trend is still intact. A pullback that reverses around the halfway mark tells you buyers (or sellers) defended the move without letting it fully unwind.
Here's the genuine technicality most guides skip: the 50% retracement is not actually a Fibonacci ratio. It's simply the level halfway between the start and end of the impulse leg. It survives on every charting platform because it's the most-watched pullback level in the toolkit — and in markets, a level being widely watched is part of what makes it work.
In practice you don't want a razor-thin line. You want a zone. The strongest continuations tend to hold somewhere in the ~45–66% band — the stretch that runs from just above the 50% line up into the 0.618–0.65 "golden pocket." Definition worth memorising: the golden pocket is the 0.618–0.65 retracement zone, the deeper edge of the pullback band where trend continuations most often ignite. The 0.5 level is the near edge of that same band. Treat 45–66% as one decision region, not five separate lines.
What has to happen before you enter?
Nothing about a price touching the 50% level is a signal on its own. A touch is an invitation, not a trade. Before you risk a cent, the setup has to clear five quality gates — the same five the scanner enforces on every candidate:
- A genuine impulse leg — a clean, decisive move with real range, not a slow grind or three overlapping candles. If you can't point at the impulse instantly, there isn't one.
- A pullback into the ~45–66% zone — price retraces into the band around the 50% level / golden pocket. Too shallow (under ~38%) and it's barely a pause; too deep (past ~78%) and the move is probably failing.
- A confirmation candle that CLOSES at the level — this is the whole ballgame. You need a candle that closes back in the trend's direction at the zone, not just a long wick that pokes it and vanishes. A wick-only touch is noise. If you're fuzzy on what qualifies, this breakdown of what makes a valid confirmation candle is worth ten minutes.
- A trending market — an ADX-style trend filter to confirm you're in a trend, not chop. Retracement entries are continuation trades; in a range they just get chopped up.
- An a risk:reward worth taking — before entry, the distance to a sensible target has to justify the distance to a sensible stop. If it doesn't, you pass. No exceptions for a chart you "really like."
Only when all five line up do you have a trade. Miss any one and it's a scan result, not a signal.
| Gate | What you're checking | Fail looks like |
|---|---|---|
| Impulse | Clean directional leg with range | Overlapping, sideways candles |
| Pullback | Retrace into ~45–66% zone | Under 38% or past 78% |
| Confirmation | Candle closes at the level | Wick tags it, closes away |
| Trend filter | ADX-style trend present | Flat, choppy, rangebound |
| Risk:reward | Target justifies the stop | Reward < risk |
Where do the stop and target go?
Entry is on the break of the confirmation candle — you buy (or sell) as price trades through the high (or low) of the candle that closed at the zone. That break is the market voting to continue.
The stop goes just beyond the spike — the extreme of the pullback — with an ATR floor so it isn't jammed so tight that normal noise stops you out. The logic: if price trades back through the low that formed your setup, the retracement thesis is simply wrong, and you want to be out cheaply. ATR-flooring keeps the stop at a sane distance on volatile instruments instead of pinning it a few ticks away.
The natural target is the 1.618 extension of the original impulse leg — measured from the move you're trading, projected beyond its prior high (or low). It's not magic; it's a structural, math-derived level where extended moves frequently stall, which makes it a logical place to book or trail. The mechanics of measuring and using it are covered in this walkthrough of the 1.618 extension as a target.
Put together, one trade has four fixed prices decided before you're in:
- Entry — break of the confirmation candle
- Stop — ATR-floored, just past the pullback spike
- Target — the 1.618 extension of the impulse
- Invalidation — a candle closing back through the far side of the zone (get out early; don't wait for the stop)
How does long vs short change with yesterday's bias?
The strategy is fully symmetrical — the shape is identical, only the direction flips. For a long, you need an up-impulse, a pullback down into the zone, and a confirmation candle that closes back up; entry breaks the candle high, stop sits under the spike. For a short, you need a down-impulse, a pullback up into the zone, and a confirmation candle that closes back down; entry breaks the candle low, stop sits above the spike.
Reading yesterday's bias just tilts which way you're hunting. If the prior session closed strong and higher timeframes point up, you favour long retracements and treat pullbacks as buying opportunities. If yesterday closed weak into support failure, you favour short retracements and let bounces into the 50% zone set up sells. You're not predicting — you're aligning the continuation trade with the direction the market has already shown, so the trend filter and your bias agree instead of fighting.
What does a full worked example look like?
Both examples below are illustrative — labelled numbers to show the mechanics, not a record of any real trade.
Illustrative long — Gold (XAU/USD), 1H. Gold pushes from 2,300 → 2,340 in a tight, decisive impulse (the leg). Over the next few hours it drifts back and prints a wick down to 2,318, then a candle closes at 2,320 — right on the 50% level (halfway of the 40-point leg), inside the zone. That's the confirmation. The trend filter reads "trending," and the maths clears gate five:
- Entry: break of the confirmation high → 2,322
- Stop: ATR-floored under the 2,318 spike → 2,316 (6-point risk)
- Target: 1.618 extension of the 2,300–2,340 leg → ~2,365 (43-point reward)
- Structure: roughly 7R of room against 1R of risk — a genuine setup worth taking
Illustrative short — Nasdaq 100 (US100), 4H. The index breaks down from 19,800 → 19,500 (a clean 300-point down-impulse). It bounces and wicks up to 19,655, then a candle closes at 19,650 — the 50% level of the leg, inside the zone, with the trend filter still pointing down.
- Entry: break of the confirmation low → 19,635
- Stop: ATR-floored above the 19,655 spike → 19,675 (40-point risk)
- Target: 1.618 extension of the 19,800–19,500 leg → ~19,315 (320-point reward)
- Invalidation: a 4H candle closing back above ~19,700 kills the thesis — exit early rather than hoping
Same five gates, same four prices, opposite direction. Once you've internalised the pattern, every valid setup on every market reads the same way — which is exactly why it can be scanned for mechanically.
One genuine note on doing this by hand
The method works. The problem is watching for it. A valid setup can form on any of 293 markets, on any of 8 timeframes, and the signal only exists in the moment a candle closes at the level — miss the close and you've missed it. Nobody can sit on 2,000-plus chart-timeframe combinations waiting for that one bar. That's the entire reason FibScanner exists: it watches all of them and alerts you the moment a setup clears the five gates, so you show up for the decision instead of the surveillance. You can run the full engine free on one market and one timeframe — a real trial, no card — and the strategy guide walks through every gate in depth. As supporting proof that the alerts hold up: it reads only closed candles and logs every call it makes, so it can't repaint a signal after the fact.
Frequently asked questions
Is the 50% level a real Fibonacci ratio?
No — and it's worth being clear about it. The 50% level is simply the midpoint of the impulse leg, not a value derived from the Fibonacci sequence like 0.382 or 0.618. It's included on every Fib tool because it's the most-watched pullback level, and that shared attention is part of what gives it weight.
What timeframe works best for a 50% retracement entry?
There's no single "best" — the pattern is the same on a 5-minute chart and a daily. Higher timeframes (4H and up) tend to give cleaner impulse legs and fewer false confirmations but far fewer setups; lower timeframes give more signals with more noise. Match the timeframe to how often you can actually be at the screen, and let the trend filter do the filtering.
What if price blows straight through the 50% level?
Then there's no trade — and that's the system working. A price that slices through the zone without a confirmation candle closing at it has told you the retracement failed. You only ever act on the close at the level, never the touch, precisely so a clean break-through leaves you flat instead of trapped.
Do I need the exact 0.5, or is a zone okay?
A zone. Treat the ~45–66% band as one decision region — from just above the 50% line into the 0.618–0.65 golden pocket. Demanding a tick-perfect touch of 0.500 will make you miss good setups that confirm a few points either side; what matters is that the confirmation candle closes inside the band, in the trend's direction.
Does this work on crypto and FX, or just stocks?
The pattern is market-agnostic — impulse, pullback, confirmation, continuation shows up in crypto, FX, gold, indices and commodities alike, because it's a behaviour of trending price, not of any one asset class. What changes between markets is volatility, which is exactly why the stop is ATR-floored rather than a fixed distance.
