

How to Use Fibonacci Retracement (A Practical Guide)
Learning **how to use Fibonacci retracement** comes down to three skills: drawing the tool consistently, knowing which of its levels is actually worth a trade, and using the extension levels to set a target before you ever click buy. Most traders slap the tool on a chart, see price "react" to a line somewhere, and convince themselves it works. This guide takes the practical route instead — what the levels are, why they sometimes matter, how to draw them the same way every time, and the specific conditions that turn a pretty line into a setup worth taking.
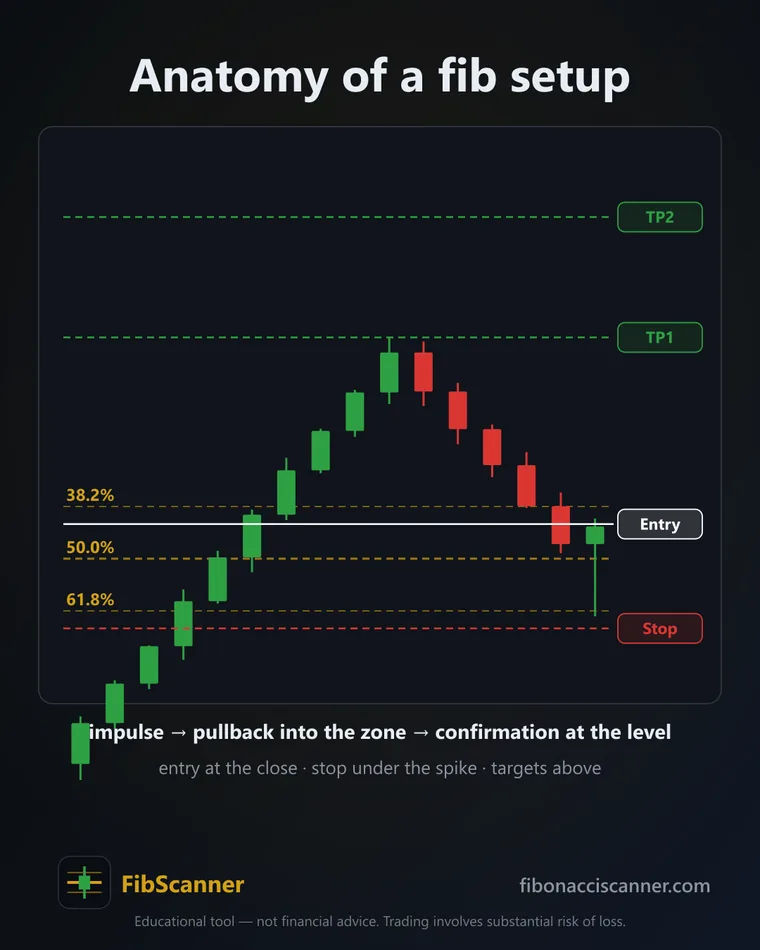
By the end you'll have a repeatable process you can apply to any liquid market, plus a checklist of the mistakes that quietly wreck most people's results. No mysticism, no "the golden ratio governs the universe" filler. Just the mechanics.
What is Fibonacci retracement?
Fibonacci retracement is a tool that measures how far a price has pulled back from a prior move, expressed as a percentage of that move. You anchor it to a swing low and a swing high (or high and low), and it draws horizontal lines at fixed ratios — 23.6%, 38.2%, 50%, 61.8%, and 78.6% — where price often pauses, reverses, or continues.
Here's the core idea in plain terms. Markets don't move in straight lines. An impulse move up is followed by a pullback, then (often) another push in the original direction. Fibonacci retracement gives you a standardized ruler for that pullback. Instead of eyeballing "it dropped a bit," you get "it retraced 61.8% of the prior leg." That precision is the whole point — it lets you plan an entry, a stop, and a target at levels you defined in advance rather than reacting emotionally as candles print.
The ratios come from the Fibonacci sequence (1, 1, 2, 3, 5, 8, 13, 21…), where each number is the sum of the two before it. Divide any number by the next and you approach 0.618; divide by the number two places up and you approach 0.382. The 50% level isn't technically a Fibonacci ratio at all — it's just the midpoint, kept because price respects the halfway mark of a move surprisingly often.
That's Fibonacci retracement explained at the mechanical level. The more interesting question is why any of this would work.
Why does price react to Fibonacci levels?
Price reacts to Fibonacci levels mostly because enough traders watch the same levels and act on them — it's a self-fulfilling coordination point, not a law of physics. When thousands of participants place buy orders around the 61.8% retracement, that clustering of orders creates real support. The level "works" because people believe it works and put money behind it.
It's worth being genuine about this, because the folklore around Fibonacci gets mystical fast. There is no cosmic force pulling EUR/USD to a golden-ratio line. What actually happens is more grounded:
- Order clustering. Retail and algorithmic traders alike drop limit orders, stops, and take-profits near the well-known ratios. Concentrated orders move price.
- Confluence with real structure. Fib levels often line up with prior support/resistance, round numbers, moving averages, or a trendline. When several reasons to buy stack at the same price, the reaction is stronger. The Fib line frequently gets credit for what confluence actually caused.
- A shared framework for "value." In an uptrend, a deeper pullback feels like a discount. The 50–61.8% zone is where a lot of participants independently decide the pullback is "deep enough" to re-enter.
The practical takeaway: treat Fibonacci as a decision framework, not a crystal ball. A level in isolation is a coin flip. A level that coincides with the structure of the market — a genuine trend, a real prior high, a confirmation candle closing right there — is a setup. Hold that distinction in your head for the rest of this guide, because it's what separates traders who use Fibonacci from traders who just decorate charts with it.
How do you draw a Fibonacci retracement?
To draw a Fibonacci retracement, anchor the tool to the two ends of one clean impulse move: in an uptrend, click the swing low and drag to the swing high; in a downtrend, click the swing high and drag to the swing low. The tool then plots the retracement levels across the range between those two points. Draw it the same way every time or your levels will drift.
Step by step:
- Identify one clear impulse leg. You want an obvious, mostly one-directional move — a strong push with limited overlap between candles. Skip choppy, sideways ranges; the tool needs a real move to measure.
- Anchor low-to-high in an uptrend (or high-to-low in a downtrend). The 0% sits at the end of the move; 100% sits at the start. Your retracement zone (the levels between) fills the space price will pull back into.
- Use wicks, and be consistent. Anchor to the extreme of the candle (the wick tip), not the body, and do it the same way on every chart. Consistency matters more than which convention you pick.
- Prefer swings that are visible on the higher timeframe. A Fib drawn off a swing that stands out on the 4-hour or daily carries more weight than one drawn off a minor 5-minute wiggle, because more participants can see the same anchors.
The single biggest source of "Fibonacci doesn't work for me" is inconsistent or arbitrary anchoring. If you draw it off a different swing each time until the lines happen to fit price, you're curve-fitting, not analyzing. Two traders using the same rules should land on nearly the same levels. If you want a full walkthrough with annotated examples, our dedicated piece on how to draw a Fibonacci retracement correctly goes deeper on choosing the right swing points. And if you'd rather punch in the high and low and get the exact price levels instantly, the Fibonacci calculator does the arithmetic for you.
Which level should you actually trade?
The level worth trading is the 50%–61.8% retracement zone — often called the golden pocket — because it's deep enough to shake out weak hands but shallow enough that the original trend is likely still intact. The 23.6% and 38.2% levels are usually too shallow (the pullback may not be finished), and anything past 78.6% suggests the move is failing rather than resting.
The golden pocket is the 0.618–0.65 retracement zone where the strongest reactions tend to cluster — the meeting point of the classic 61.8% ratio and the slightly deeper 0.65 level. It's the area professional-minded traders watch most closely. We break down exactly why in our guide to what the golden pocket is, but the short version is that it's the sweet spot on the risk-versus-probability curve.
Here's a quick reference for how to read each level:
| Level | What it usually means | Trade relevance |
|---|---|---|
| 23.6% | Very shallow pullback | Often too early — pullback may not be done |
| 38.2% | Mild pullback in a strong trend | Watchable, but weaker on its own |
| 50% | Psychological midpoint | Common reaction zone; decent with confluence |
| 61.8% | The classic "golden ratio" level | High-interest zone — top of the pocket |
| 65% | Deep golden-pocket edge | Strong reactions cluster here |
| 78.6% | Deep retrace | Last stand — a close beyond it warns the move is failing |
But — and this is the part most guides skip — a level alone is not a reason to trade. Knowing "how to trade Fibonacci" well means demanding more than a touch. Before I'll take a Fib entry, I want to see:
- A genuine impulse leg feeding into the pullback (not a limp, overlapping drift).
- Price pulling into that 45–66% zone, not stalling at 23.6% or blowing through 78.6%.
- A confirmation candle that CLOSES at the level, not just a wick that pokes it and gets rejected. A close tells you buyers actually defended the zone; a lone wick can be noise.
- A trending market, not chop — a trend filter (ADX-style) keeps you from trading Fibs inside a range where they mean little.
- An a risk-to-reward worth taking — if the stop and target don't give you a sensible ratio, the setup isn't worth taking no matter how clean the level looks.
That five-point filter is the difference between "there's a Fib level here" and "there's a setup here." Entry is on the break of the confirmation candle; the stop goes just under the swing (floored by a volatility buffer so a normal wick doesn't take you out); the target comes from the extensions, which is where we go next.
How do you use extensions to set targets?
Fibonacci extensions project where price may travel once it breaks out of the retracement, using ratios beyond 100% — most importantly the 1.618 extension, which serves as a natural first target. Where retracement measures the pullback, extension measures the continuation. Together they give you both sides of the trade: entry from the retracement, target from the extension.
The key extension levels are 1.272, 1.618, and 2.618. To plot them, you're measuring the size of the original impulse leg and projecting that proportion forward from the pullback low (in an uptrend). The 1.618 extension — the golden ratio again — is the one most traders anchor a first target to, because it represents the move extending roughly 61.8% beyond its prior high.
A clean way to structure it:
- Entry on the break of your confirmation candle in the golden pocket.
- Stop just beyond the swing that formed the pullback, with a volatility buffer so ordinary noise doesn't clip you.
- First target at the 1.618 extension of the original impulse leg.
- Optional runner toward 2.618 if the trend is strong and you want to trail a portion.
The reason this matters: defining your target before entry forces you to check risk-to-reward properly. If your stop is 30 pips away and the 1.618 extension only sits 25 pips above entry, the math doesn't support the trade — even if the setup is otherwise textbook. Planning the exit at the same time as the entry is what keeps you from the classic trap of taking beautiful setups with ugly risk. The Fibonacci calculator will give you both the retracement and extension prices from a single high/low, so you can eyeball the risk-to-reward in seconds.
How to use Fibonacci retracement: a worked example
Let's walk one all the way through. Everything here is illustrative — invented numbers to show the mechanics, not a prediction and not a result.
Imagine gold (XAU/USD) on the 1-hour chart. It rallies cleanly from 2,000 up to 2,050 — a $50 impulse leg with strong, mostly one-directional candles. That's your impulse. Now price starts to pull back.
You draw your retracement from the 2,000 swing low to the 2,050 swing high. That plots:
- 38.2% → 2,031
- 50% → 2,025
- 61.8% → 2,019
- 65% → 2,017.50
Price drifts down and reaches 2,019 — right into the golden pocket (the 61.8%–65% zone). So far it's just a level touch. Now you wait for the filter to clear:
- Impulse? Yes — clean $50 leg.
- Into the 45–66% zone? Yes — 2,019 is dead in the pocket.
- Trend filter? Say your ADX-style read confirms an uptrend, not chop. Pass.
- Confirmation candle? You wait. A 1-hour candle forms, dips to 2,017, and closes back at 2,021 — a bullish close that defended the zone. That's your confirmation. A wick to 2,019 that closed at 2,015 would not have qualified.
Entry triggers on the break above that confirmation candle's high, say 2,022. Your stop goes just under the pullback low with a volatility buffer — under 2,017, call it 2,015. Risk is 7 dollars per unit (2,022 − 2,015).
Now the target. You project the 1.618 extension of the original $50 leg from the pullback low. That lands around 2,050 + (0.618 × 50) ≈ 2,081 as an extended target, with the prior high at 2,050 as a nearer checkpoint. Entry 2,022, stop 2,015, first objective well above 2,050 — the risk-to-reward clears comfortably. That's a plan, defined entirely before the trade is live.
Notice what did the work here: not the Fib line by itself, but the combination — impulse, pocket, trend, confirming close, and a risk-to-reward worth taking. Strip out any one of them and it's a weaker trade. That stack of conditions is the actual method; the lines are just the measuring tape.
What are the most common Fibonacci retracement mistakes?
The most common Fibonacci mistakes are trading a level with no confirmation, anchoring the tool inconsistently, and ignoring the broader trend. Fix those three and you eliminate most of the "it doesn't work" frustration. Here are the ones I see over and over:
- Trading the wick, not the close. Price tags 61.8%, you jump in, and it slices straight through. Wait for a candle to close defending the level. A touch is an invitation; a close is confirmation.
- Curve-fitting the anchors. Redrawing the tool off different swings until the lines "line up" with price is just confirmation bias with extra steps. Pick clear swings on a meaningful timeframe and commit to them.
- Fibbing a range. Fibonacci is a trend-continuation tool. In a sideways, choppy market the levels are near-meaningless. Use a trend filter and stand down when there isn't one.
- No stop discipline. Placing the stop right at the level guarantees you get clipped by normal noise. Put it beyond the swing with a volatility buffer so an ordinary wick doesn't end the trade prematurely.
- Forcing the target. If the extension target doesn't sit far enough beyond entry to justify the stop, skip the trade. A clean level with poor risk-to-reward is still a bad trade.
- Ignoring confluence. A Fib level alone is weak. A Fib level that overlaps prior support, a round number, or a moving average is much stronger. Let the market give you more than one reason.
- Watching too few markets, too obsessively. Setups this specific are rare on any single chart. Stare at one pair waiting for a perfect pocket-plus-confirmation and you'll either wait forever or force a mediocre trade out of boredom.
That last point is the genuine, unglamorous problem with trading Fibonacci well: the good setups are infrequent, and they appear on whichever market happens to be trending right now — not necessarily the one you're watching.
Here's where a scanner earns its keep. You genuinely can't sit on 293 markets across 8 timeframes waiting for a clean impulse to pull into the golden pocket and close a confirmation candle there. That's the exact job FibScanner was built for — it watches every one of those charts around the clock and only pings you when a candidate passes all five quality gates we walked through above (real impulse, pocket pullback, confirming close, trend filter, a risk-to-reward worth taking). It reads only closed candles and logs every call it makes, so what you see is what it actually flagged — no hindsight repainting. You can run the full engine free on one market and one timeframe, no card required, and if you want the complete method laid out end to end, the strategy guide covers it. Let the software do the watching so you can spend your attention on the handful of setups that clear the bar.
Frequently asked questions
Is Fibonacci retracement a leading or lagging indicator?
It's neither in the usual sense — it's a static drawing tool, not a calculated indicator. Once you anchor it to a swing high and low, the levels are fixed and sit ahead of price, marking zones to watch. That's why it's used for planning entries and targets in advance rather than reacting to a signal after the fact.
What are the best Fibonacci retracement levels to use?
For trade entries, focus on the 50%–61.8% zone (the golden pocket) — deep enough that the pullback is likely finished, shallow enough that the trend is probably intact. Use the 38.2% level as a "trend is strong" watch zone and treat a close beyond 78.6% as a warning that the move may be failing rather than resting.
Does Fibonacci retracement work on all timeframes?
The math works identically on any timeframe, from the 1-minute to the weekly. Higher timeframes generally produce more reliable levels because more participants see the same swings and place orders around them. The tool works best in trending conditions on any timeframe, and poorly in choppy ranges regardless of the interval.
Can Fibonacci retracement be used on its own?
It shouldn't be. On its own, a level is close to a coin flip. Combine it with a trend filter, wait for a confirmation candle to close at the level, and look for confluence with prior support/resistance or round numbers. Fibonacci is a framework for organizing a trade, not a standalone buy or sell signal.
How do I set a target after a Fibonacci entry?
Use Fibonacci extensions. Measure the original impulse leg and project the 1.618 extension forward from the pullback — that's a natural first target. Define it before you enter so you can check that the distance to target justifies the distance to your stop; if the risk-to-reward doesn't work, pass on the trade.
