

How to Draw Fibonacci Retracement Correctly
Getting your levels to actually mean something starts with one skill: knowing **how to draw Fibonacci retracement correctly**. Most traders blame the tool when their levels don't hold — but the tool is fine. The problem is almost always the swing it was anchored to. Draw it on the wrong leg and every level underneath is fiction. Draw it on a clean impulse and the retracement zones line up with where price actually reacts.
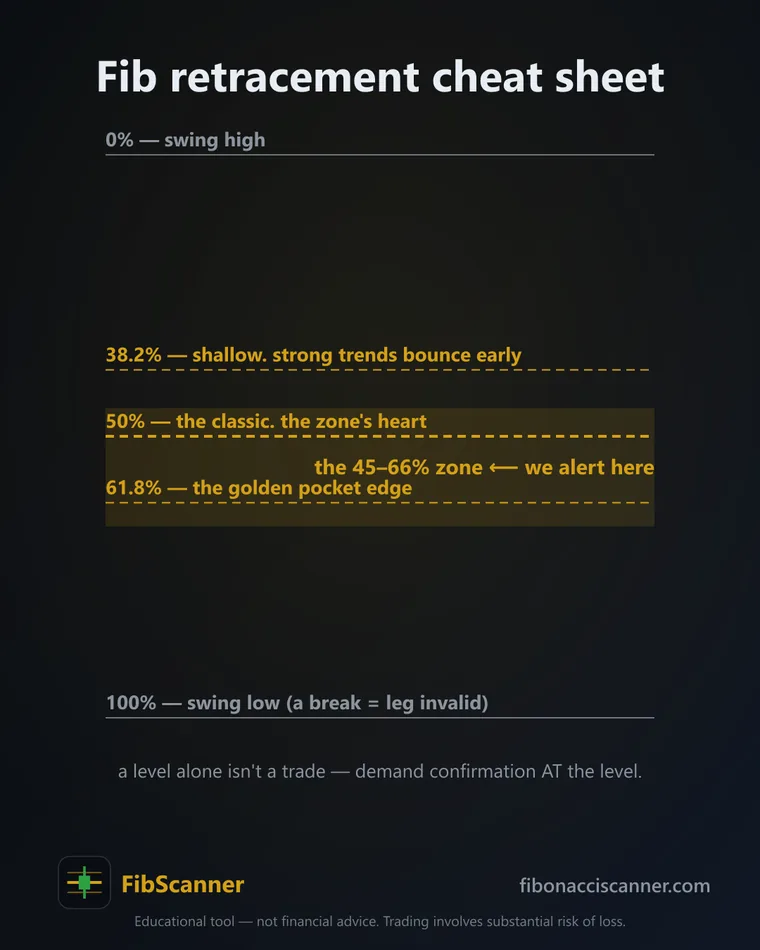
A Fibonacci retracement is a set of horizontal levels — 0.236, 0.382, 0.5, 0.618 and 0.786 — plotted between a swing high and a swing low to mark where a pullback is likely to pause before the trend resumes. Below is a practical, step-by-step way to anchor it properly, get the direction right, and avoid the drawing mistakes that quietly wreck otherwise good setups.
How do you draw Fibonacci retracement correctly?
To draw a Fibonacci retracement correctly, anchor the tool to the two ends of a single clean impulse leg — swing low to swing high in an uptrend, swing high to swing low in a downtrend — and let the levels fall inside that range. The entire skill is picking the right two points; the software draws the rest.
Here are the steps:
- Identify the dominant trend on the timeframe you're trading. Retracements only make sense inside a trend — you're measuring a pullback against a move, so there has to be a move.
- Find the impulse leg that created the current push. This is the obvious, decisive run that any chart-reader would point at and call "the move."
- Anchor point 1 at the origin of that leg — the swing point where the impulse began.
- Drag point 2 to the extreme — the swing high or low where the impulse ended. Your 0% should sit at the most recent extreme, 100% at the start.
- Read the reaction zone. Watch how price behaves between the 0.5 and 0.618 levels — the golden pocket — where trend pullbacks most often stall and turn.
The 1.618 extension that appears beyond the leg is a natural target if the trend continues. If you want the full trade context around these levels, our walkthrough on how to use Fibonacci retracement in a live setup picks up where this drawing guide leaves off.
What swing do you draw the Fibonacci on?
Draw it on the most recent completed impulse leg — the clean, decisive move that established the current trend direction. Not the whole multi-week range, and not a tiny intraday wiggle: the one obvious leg that stands out from everything around it.
This is where the term swing high swing low does real work. A swing high is a candle peak flanked by lower highs on both sides; a swing low is a trough flanked by higher lows on both sides. Those two pivots are the anchors of your tool. Pick pivots that are genuinely visible — a peak that only the tallest wick in a cluster of overlapping candles created is a weak anchor, and levels drawn from it tend to be noise.
Two practical rules keep this consistent:
- Match the swing to your timeframe. If you trade the 1-hour chart, anchor to swings that are obvious on the 1-hour chart, not to a micro-pivot you can only see on the 5-minute.
- Use the extremes, and be consistent. Anchor to the highest high and lowest low of the leg (the wick tips), and do it the same way every time. Consistency matters more than the wick-versus-body debate — flipping between the two is what makes levels look random.
Do you draw high-to-low or low-to-high?
Direction follows the trend, and it is not optional. In an uptrend, you draw from the swing low up to the swing high, so the retracement levels sit below current price — exactly where a pullback would offer an entry back in the trend's direction. In a downtrend, you flip it: swing high down to swing low, so the levels sit above price.
The logic: you always measure the retracement from the end of the impulse back toward its start. The 0% level belongs on the most recent extreme (where the move finished), and the 100% level on the origin (where it began). Get the direction backwards and your "levels" invert — the golden pocket lands in empty space that price already blew through, and nothing lines up. If the arithmetic ever feels fiddly, a Fibonacci calculator lets you plug in your high and low and see every level before you commit the drawing to the chart.
How do you know it's a real impulse, not noise?
A real impulse is a directional move that clearly separates itself from the surrounding chatter: several candles pushing the same way, larger-than-average range, and a decisive break of a prior swing point. Noise is small, overlapping candles drifting sideways inside a range. If you have to squint to see the move, it is not the swing to draw on.
Run a quick checklist before anchoring:
- Did it break structure? A genuine leg takes out a previous swing high (up) or low (down), not just a single candle's wick.
- Is the range expanding? Impulse candles are noticeably bigger than the ones before them. Shrinking, choppy candles are a range, not a leg.
- Is there a trend to retrace at all? In a flat, sideways market there is no impulse to measure — Fibonacci levels drawn in chop rarely hold.
This is exactly the judgment that's hard to make at 2 a.m. across dozens of charts, so it helps to make it objective. FibScanner's engine treats "a genuine impulse leg" and "a real trend, not chop" as two of five hard quality gates a setup must pass — the trend filter is an ADX-style measure, not a gut call — so a wiggle inside a range never gets mistaken for a move worth drawing on.
What are the most common drawing mistakes?
The number-one Fibonacci drawing mistake is anchoring to the wrong swing — a minor wiggle or an incomplete leg instead of the dominant impulse. Almost every other error follows from rushing the same two clicks. Here are the ones that do the most damage and how to fix each:
| Mistake | Why it hurts | Fix |
|---|---|---|
| Drawing on the wrong swing | Every level is derived from bad anchors, so none of them mean anything | Anchor to the one obvious impulse leg on your timeframe |
| Wrong direction (high-to-low in an uptrend) | Levels invert and land where price already traded | Low-to-high in uptrends, high-to-low in downtrends |
| Mixing wicks and bodies | Inconsistent anchors make levels shift trade to trade | Pick one method (wick extremes) and never switch |
| Redrawing until it "fits" | You're curve-fitting to a bias, not reading the market | Draw once on the clean leg and leave it |
| Using a leg that's too big or too small | Levels are either too wide to act on or pure noise | Match the swing size to your trading timeframe |
The through-line: the tool is not the edge. Two well-chosen anchor points are. Get those right and the levels do their job; get them wrong and no amount of confluence, indicators, or fancier ratios will save the drawing.
Watch the swings you can't sit on
You can't stare at 293 markets across 8 timeframes waiting for a clean impulse and a pullback into the golden pocket to line up — but that patient watching is exactly where a good Fib entry comes from. FibScanner does the watching for you: it only fires when a setup clears all five quality gates, including a genuine impulse leg and a confirmation candle that closes at the level rather than just wicking it. You can try the full engine free on one market and one timeframe — start with the free tier or read the method guide to see exactly what each gate checks before you rely on a single level.
Frequently asked questions
Should I use candle wicks or bodies to anchor the Fib?
Wick extremes (the absolute high and low of the leg) are the most common and the most consistent choice, because they capture the true range of the move. What matters more than the choice itself is doing it the same way every time — mixing wicks on one trade and bodies on the next is what makes your levels look unreliable.
Which Fibonacci levels matter most?
The 0.5 level and the 0.618 level — together the "golden pocket" — are the zone most traders watch for trend pullbacks, with 0.786 as a deeper last-chance level. The golden pocket is roughly the 0.5–0.65 retracement region where a healthy pullback tends to pause before the trend resumes. The 0.236 and 0.382 levels tend to matter more in strong, shallow trends.
Can Fibonacci retracement be drawn on any timeframe?
Yes — the method is identical on a 5-minute chart or a weekly one. The rule is to anchor to a swing that is clearly visible on the timeframe you're trading, rather than borrowing a pivot from a much smaller or larger chart, which is a common source of levels that don't hold.
Why do my Fibonacci levels keep failing?
The usual cause is the anchor, not the ratios. If levels routinely get ignored, check that you drew on a real impulse leg (not a range wiggle), in the correct direction for the trend, using consistent anchor points. Fixing the swing selection fixes most "the levels don't work" complaints.
