
How to Scan Multiple Charts at Once (Without Losing Your Mind)
To scan multiple charts at once you have four practical options: a multi-chart grid layout, a screener that filters on criteria, price alerts on levels you mark yourself, or an automated scanner that watches every market and only speaks when a setup is complete. Grids and alerts work up to roughly a dozen markets; past that, the arithmetic beats you — and most traders hit that wall without realising the problem is coverage, not discipline. This article walks through each method, where each one breaks, and how to choose based on how many markets you actually want to cover.
How many charts can one person realistically watch?
Realistically, a focused trader can actively watch four to six charts and passively monitor another six to twelve — call it a dozen markets before attention starts failing. Beyond that you're not watching charts, you're rotating through them and hoping the important one is on screen when it matters.
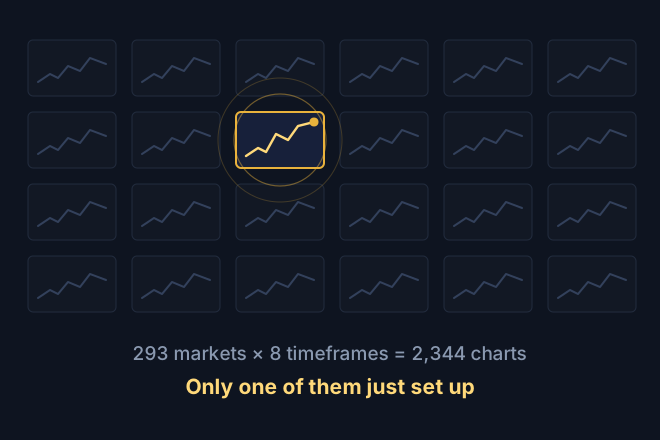
The arithmetic is unforgiving. Watching one market on one timeframe is one chart. Watching it properly across the timeframes that matter — say 15m, 1h, 4h and daily — is four. Do that across 20 markets and you're at 80 chart-views, refreshed continuously, all session. Do it across a serious watchlist of 293 markets on 8 timeframes and you're at 2,344 charts.
Nobody watches 2,344 charts. That isn't a character flaw or a focus problem, and no amount of screen real estate or discipline fixes it. It's a coverage problem, and coverage problems need a different tool — not more effort.
There's a second cost people underestimate: the good setups don't wait for you. A confirmation candle closes on the 4h at 3am your time, or during the school run, or while you're deep in the one chart you happened to have open. The setup was there; you weren't. That's not bad luck, it's a scheduling mismatch between markets that run continuously and a human who doesn't.
Method 1: the multi-chart grid layout
A multi-chart grid splits one screen into several synchronised charts — typically 2, 4, 6, 8 or 16 panes — so you can see several markets or timeframes side by side without switching tabs. Every major charting platform offers one, and it's the natural first answer to "how do I watch more than one thing".
It genuinely helps for a narrow job:
- Multi-timeframe on one market. Four panes of the same asset (15m / 1h / 4h / daily) is an excellent way to check whether a setup agrees with its higher timeframe.
- Correlated markets. Watching an index alongside the two or three names that lead it.
- Active management. Keeping your open positions visible while you look for the next entry.
Where it breaks is scale and attention. Past about six panes each chart is too small to read a candle close properly, so you end up squinting at exactly the detail that decides whether a setup is valid. And a grid is still passive — it shows you what's on it. If the setup forms on market number 40, the grid never mentions it, because market 40 was never on the screen.
Use a grid for depth on a few markets. Don't expect it to give you breadth.
Method 2: the screener (and why it isn't a scanner)
A screener filters a universe of markets by criteria you specify — price above a moving average, RSI under 30, volume above average — and hands back a list of names that match right now. It's the standard tool for narrowing thousands of stocks to a shortlist.
Screeners are excellent at reducing a universe. They're weak at three things that matter for setup trading:
- They're a snapshot, not a watch. A screener answers "what matches at this moment?" You have to keep running it. Most setups form over hours; the screener has no memory of what was developing.
- Indicator matches aren't setups. "RSI below 30" tells you a value crossed a threshold. It says nothing about whether there's a genuine impulse leg, whether the pullback is into a sensible zone, whether a candle actually confirmed, or what your risk would be.
- You still have to check every hit by hand. A screener returning 40 names has moved the work, not removed it. You now open 40 charts.
The distinction that clears this up: a screener filters, a scanner watches. A screener asks "which markets meet these conditions right now?" A scanner asks "has a complete, tradeable setup formed on any market I care about, and is it still valid?" Related but different jobs — and if you want the second one, a screener will quietly disappoint you.
Method 3: price alerts on levels you mark yourself
Manual alerts are the sensible middle ground: you do the analysis, mark the level, and let the platform ping you when price arrives. For a small watchlist this is the highest-quality method there is, because a human decided the level mattered.
It also has a hard ceiling, and the ceiling is maintenance. Every alert is something you had to draw, and levels go stale. Mark 30 levels across 30 markets and within a fortnight a good share of them are wrong — the swing that defined them has been superseded, the trend has changed, the level has already been traded through.
Then there's the failure that follows: alert fatigue. Set enough alerts and most of what fires is noise — price touching a level means very little on its own. Traders respond exactly as you'd expect: they start ignoring alerts, then muting them, then miss the one that mattered. A hundred pings a day trains you to ignore pings.
A touch is not a setup. Price tagging your line tells you price arrived; it doesn't tell you anything held. That's why waiting for a confirmation candle to close matters more than the touch itself — and it's the step a plain price alert can't do for you.
Method 4: an automated scanner that only speaks when a setup is complete
An automated scanner watches every market on your list, across every timeframe you care about, and alerts only when a full setup has formed and passed a defined quality standard. It inverts the model: instead of you hunting for setups, the setups come to you — and only the ones that qualify.
The critical part is what "qualifies" means. A scanner that alerts on any level touch is just alert spam with extra steps. A useful one enforces a checklist before it says anything. The five gates we use are a reasonable standard for any scanner, whether you build it or buy it:
- A genuine impulse — a real directional leg, not sideways chop.
- A pullback into the zone — the retracement reaches a level worth trading, not any random pause.
- A confirmation candle that closed — the level held, on a completed candle, not an intrabar wick.
- A trend filter — the setup agrees with the larger structure rather than fighting it.
- A reward worth the risk — the entry, stop and target produce a ratio you'd actually take.
Two properties to insist on, because they separate a tool you can trust from one you can't:
It must read closed candles only. An indicator that recalculates on live price can show you a signal that vanishes when the candle closes — it "repaints". A backtest full of signals that were never actually available is worthless. Closed-candle logic means what you were alerted to is what really happened.
It must be quiet. The measure of a good scanner isn't how many alerts it sends, it's how few. Quiet days are the feature. If you're getting dozens of pings a day, the standard is too loose and you're back to fatigue.
How do you choose between them?
Choose by the number of markets you want covered and by how much analysis you want to do yourself:
| Markets you want covered | What actually works |
|---|---|
| 1–4 | A multi-chart grid, multi-timeframe on each |
| 5–12 | A grid for your core names + manual alerts on marked levels |
| 12–50 | Alerts become unmaintainable — an automated scanner starts paying for itself |
| 50+ | Only an automated scanner covers this; grids and manual alerts can't |
The methods aren't mutually exclusive, and the best setups usually combine them: a scanner provides breadth (something is watching everything, always), and a grid provides depth (when you're alerted, you open the chart and check it properly with your own eyes).
That last point matters. Nothing here suggests handing your decisions to software. A scanner should find candidates and do the arithmetic; you still decide whether to take the trade, and you should still look at the chart before you do. Automate the watching, keep the deciding.
If you want the scanner without building one, that's precisely what FibScanner does: it watches 293 markets across 8 timeframes for Fibonacci-retracement and range-breakout setups, applies the five gates above, reads only closed candles, and gives you the entry, stop and targets already worked out. It runs as a Chrome extension or a native Windows app — same engine, one licence key — and the free tier runs the complete engine on one market and one timeframe, no card required.
Frequently asked questions
How many charts can you realistically watch at once?
About four to six actively and up to a dozen passively. Past that, attention degrades faster than most traders expect — you're rotating between charts rather than watching them, and the odds that the right one is on screen at the right moment fall away quickly.
What's the difference between a screener and a scanner?
A screener filters a universe by criteria and returns a list of matches at this instant. A scanner continuously watches markets and alerts when a complete setup has formed and is still valid. Screeners narrow a universe; scanners watch for setups. Most traders want the second and buy the first.
Can I just use TradingView alerts for everything?
For a small, well-maintained watchlist, yes — manual alerts on levels you drew yourself are high quality because a human chose the level. The problem is maintenance and fatigue: levels go stale within weeks, and a price touch isn't a setup, so most of what fires is noise you learn to ignore.
Does watching more charts actually improve results?
Not by itself. More charts without a filter produces more marginal trades, not better ones. What broader coverage does is increase how many qualifying setups you see — which only helps if something is enforcing the quality standard before the setup reaches you.
How many timeframes should I scan?
Most traders need three or four: one for context (daily or 4h), one for the setup, and one for timing the entry. Scanning eight is useful when software does it, because it costs you nothing extra — but doing it manually across a watchlist is where the chart arithmetic becomes impossible.
Do automated scanners repaint their signals?
Some do, and it's the first thing to check. A tool that computes on live, unfinished candles can show a signal that disappears when the candle closes. Insist on closed-candle logic: if an alert fired, it should have fired on completed data and should still be there when you look.
